Who uses it: Many drought planners appreciate the SPI's versatility and value.
Advantages: The SPI can be computed for different time scales, can provide early warning of drought and can help assess drought severity. The SPI is less complex than the Palmer Drought Severity Index.
Disadvantages: The SPI is sensitive to the quantity and reliability of the data used to fit the distribution. McKee et al. (1993) recommend using at least 30 years of high-quality data. Applicability of the SPI depends on a suitable theoretical probability distribution being found to model the raw precipitation data prior to standardization.
Developed by: T. B. McKee, N. J. Doesken, and J. Kleist, at Colorado State University in 1993.
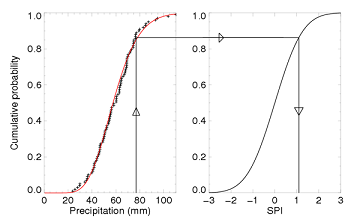
Calculation: A clear and detailed description of the steps required to calculate the SPI is provided in Lloyd-Hughes and Saunders (2002). The SPI calculation for any location is based on the long-term precipitation record for a desired period.
|
This long-term record is fitted to a probability distribution, which is
then transformed into a normal distribution so that the mean SPI for the
location and desired period is zero (Edwards and McKee, 1997).
Positive SPI values indicate greater than median precipitation, and negative
values indicate less than median precipitation. Because the SPI is normalized,
wetter and drier climates can be represented in the same way. The UCL Global
Drought Monitor only considers negative SPI values.
|
- McKee, T.B.; N.J. Doesken; and J. Kleist. 1993. The relationship of drought frequency and duration to time scales. Preprints, 8th Conference on Applied Climatology, pp. 179-184. January 17-22, Anaheim, California.
- Edwards, D.C.; and T. B. McKee. 1997. Characteristics of 20th century drought in the United States at multiple time scales. Climatology Report Number 97-2, Colorado State University, Fort Collins, Colorado.
- Lloyd-Hughes, B. and M. A. Saunders. 2002. A drought climatology for Europe, International Journal of Climatology, 22, 1571-1592.